From my time in administration, the laboratory, finance, and instructional design (both on the design and learning management systems review ends), analysis of both quantitative and qualitative data has all been in a day’s work. To me, data analysis is like a puzzle waiting to be solved. However, it is rarely as simple as simply slotting all the pieces in place. Sometimes, it is like trying to put the pieces of several different puzzles together as is the case with using mixed methods and compiling data from different sources with different purposes and criteria and varying data quality. Other times, it is like trying to put together a puzzle with missing pieces, a puzzle with no reference picture, or both. Identifying valid and reliable data; avoiding sampling errors when possible and acknowledging when not possible; and using consistent, sound methods to reconcile conflicting data are all key to successful data analysis.
TOOLS
I rely almost exclusively on MS Excel for most of my data analysis needs and subsequent displays such as charts and pivot tables. However, I have used MS PowerBI as a minor analysis tool and to display data via a tidy dashboard. In the past, I have built MS Access databases to manage large data sets and create recurring reports with a convenient mouse click.
Data Analysis in Action
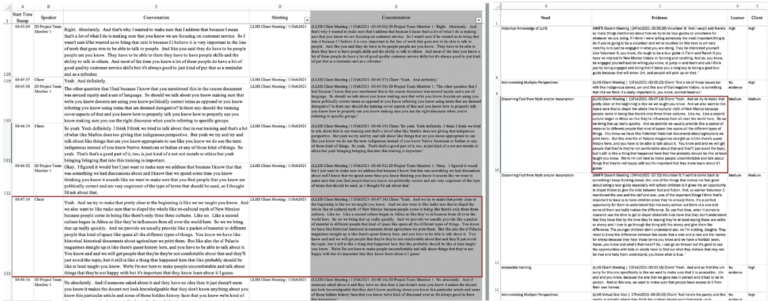
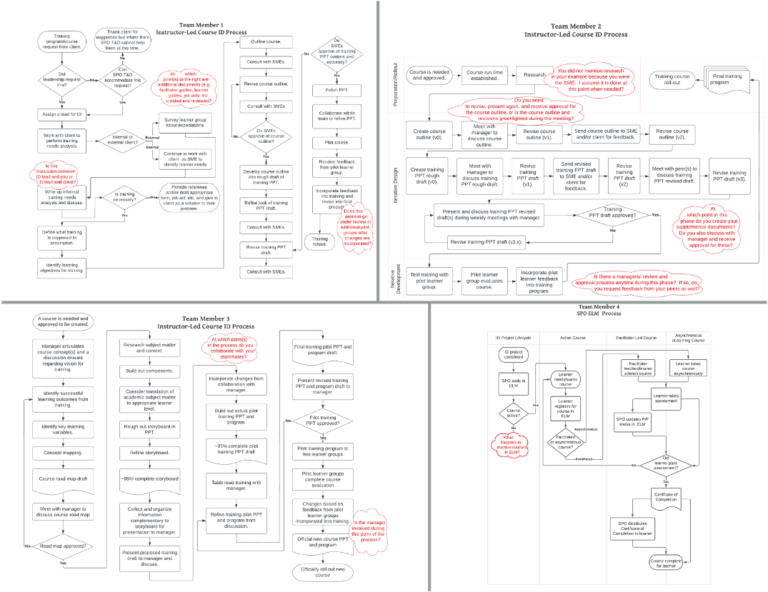
IMAGE: As part of needs assessment for a new employee development training program, I reviewed and analyzed both quantitative and qualitative data from a variety of internal and external sources. This image shows a sample of some of the results from this analysis in graphical form.


